We test 15 graphics cards to find the best one for VR
Welcome to the wonderful world of VR
Virtual reality. It's the new buzzword in the gaming world, and it was all the rage at this year's GDC. We've spent the better part of three years waiting for the Oculus Rift to ship in a non-developer version, and the day has finally arrived. And now kids all over the world—kids with lots of disposable income, mind you!—are cracking open their shiny new CV1 kits to take them for a spin. Or at least, that's the theory.
The reality is likely more of a waiting game, as no one wants to get stuck holding the virtual version of a Betamax HMD. What most users want to see before taking the $600-$800 plunge is more than a few killer apps, which is part of the reason we've had to wait so long since the Oculus Kickstarter for the first official consumer version. With the Rift and Vive hardware done, it's up to the software developers to create the VR experiences—games, videos, whatever—that will actually propel users into jumping on the bandwagon. Needless to say, people will also want to make sure the rest of their rig is up to snuff.
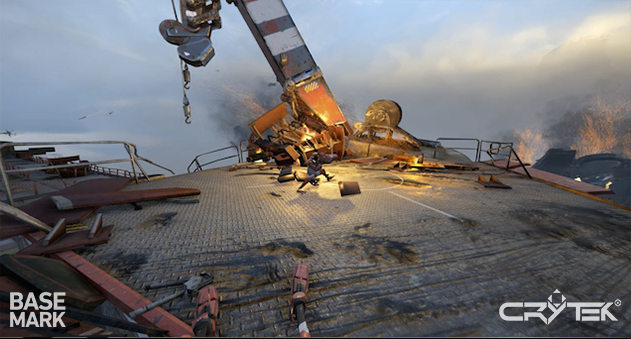
We've been looking at ways to tackle the VR benchmarking dilemma for a while now, but frankly it's almost impossible to properly benchmark and test VR performance without the final VR kit. DK1 and DK2 wouldn't suffice, as they were both lower resolution, and other differences in the hardware are also likely to create problems. We discussed Futuremark's VRMark test suite as another option, and the Basemark folks were also at GDC showing off a preliminary version of their VR Score test, but at present neither one is publicly available. Which leaves us with exactly one VR performance test that we can run, cleverly named the SteamVR Performance Test.
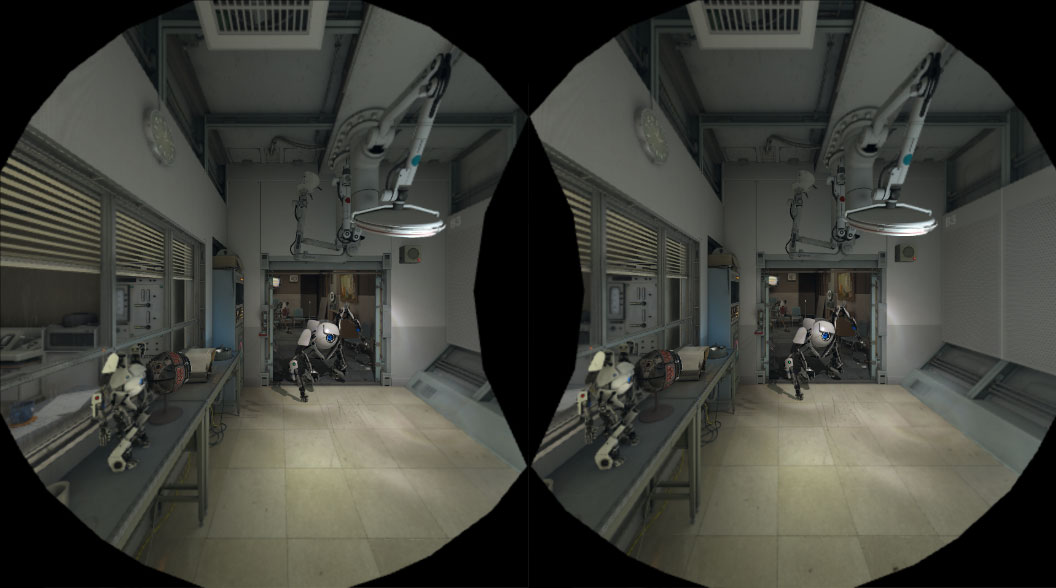
Coming to any final conclusion about graphics hardware and how well it will run future VR games and experiences on the basis of one early software sample isn't possible, so let's get that out of the way right now. The results could end up correlating really well with future VR games, or they might be mostly meaningless. We'll have different APIs (LiquidVR, VR Works, and other SDKs), and comparing and contrasting those will require additional tools. But even if we have all of that in a benchmark suite, it still doesn't tell us about the performance of actual VR games.
Consider for a moment the way the SteamVR test works. It shows a scene, which is presumably rendered off-screen in a 2160x1200 window. But since a good VR experience that doesn't make you want to spew is tied to smooth frame rates, we're likely to see a lot of developers take a scalable quality approach. This is what SteamVR does, aiming to break 90 fps at the highest quality settings possible. What that means is rather than seeing one GPU run at 60 fps and a faster GPU run at 120 fps, we're more likely to see one GPU run at the equivalent of medium quality and 100 fps while another might run at 100 fps but with much better quality overall. So how do you even compare cards using this test?
We're going to include three results, as more data tends to be better than less in instances like these. First we'll have the image fidelity score that SteamVR generates—this is the overall average quality of the rendering, which can scale from 1.0 to 11.0. Along with this figure, SteamVR provides the number of frames rendered, but we're more interested in frame rates, so we've captured those and calculated the average fps along with the average of the bottom three percent of frames—what we call the 97 percentile. If the 97 percentile is below 90, it means the particular GPU isn't likely to provide a great VR experience.
But what if you want a single figure that gives you the high-level view of things? It requires a bit of fuzzy math to get there, and we could argue about the best representation. For now, we're going to take the geometric mean of the average fps (twice) with the 97 percentile (once), and multiply that by log22 of twice the image fidelity score. That means a card gets 100 percent if it has image fidelity of 11, or about 41 percent with a fidelity score of 1.8 (which is the lowest we measured). [Ed: The goal was to find a weighting where a single 970 ended up with about twice the score of a single 950. That means finding a metric where the image fidelity isn't weighted too heavily, which is where logarithmic scales are useful.]
The biggest gaming news, reviews and hardware deals
Keep up to date with the most important stories and the best deals, as picked by the PC Gamer team.
Test Setup
Clear as mud? Great! Let's begin, and just for good measure we've tested two different CPUs/systems with our GPU collection, one our usual high-end six-core/twelve-thread Haswell-E processor overclocked to 4.2GHz, and the second a slightly more mainstream quad-core Skylake CPU running at stock 3.9GHz:
| PC Gamer's 2016 GPU Test Bed | |
|---|---|
| CPUs | Intel Core i7-5930K: 6-core HT OC'ed @ 4.2GHzIntel Core i5-6600K: 4-core @ 3.9GHz |
| Mobo | Gigabyte GA-X99-UD4 (LGA2011 v3)Asus Z170-A (LGA1151) |
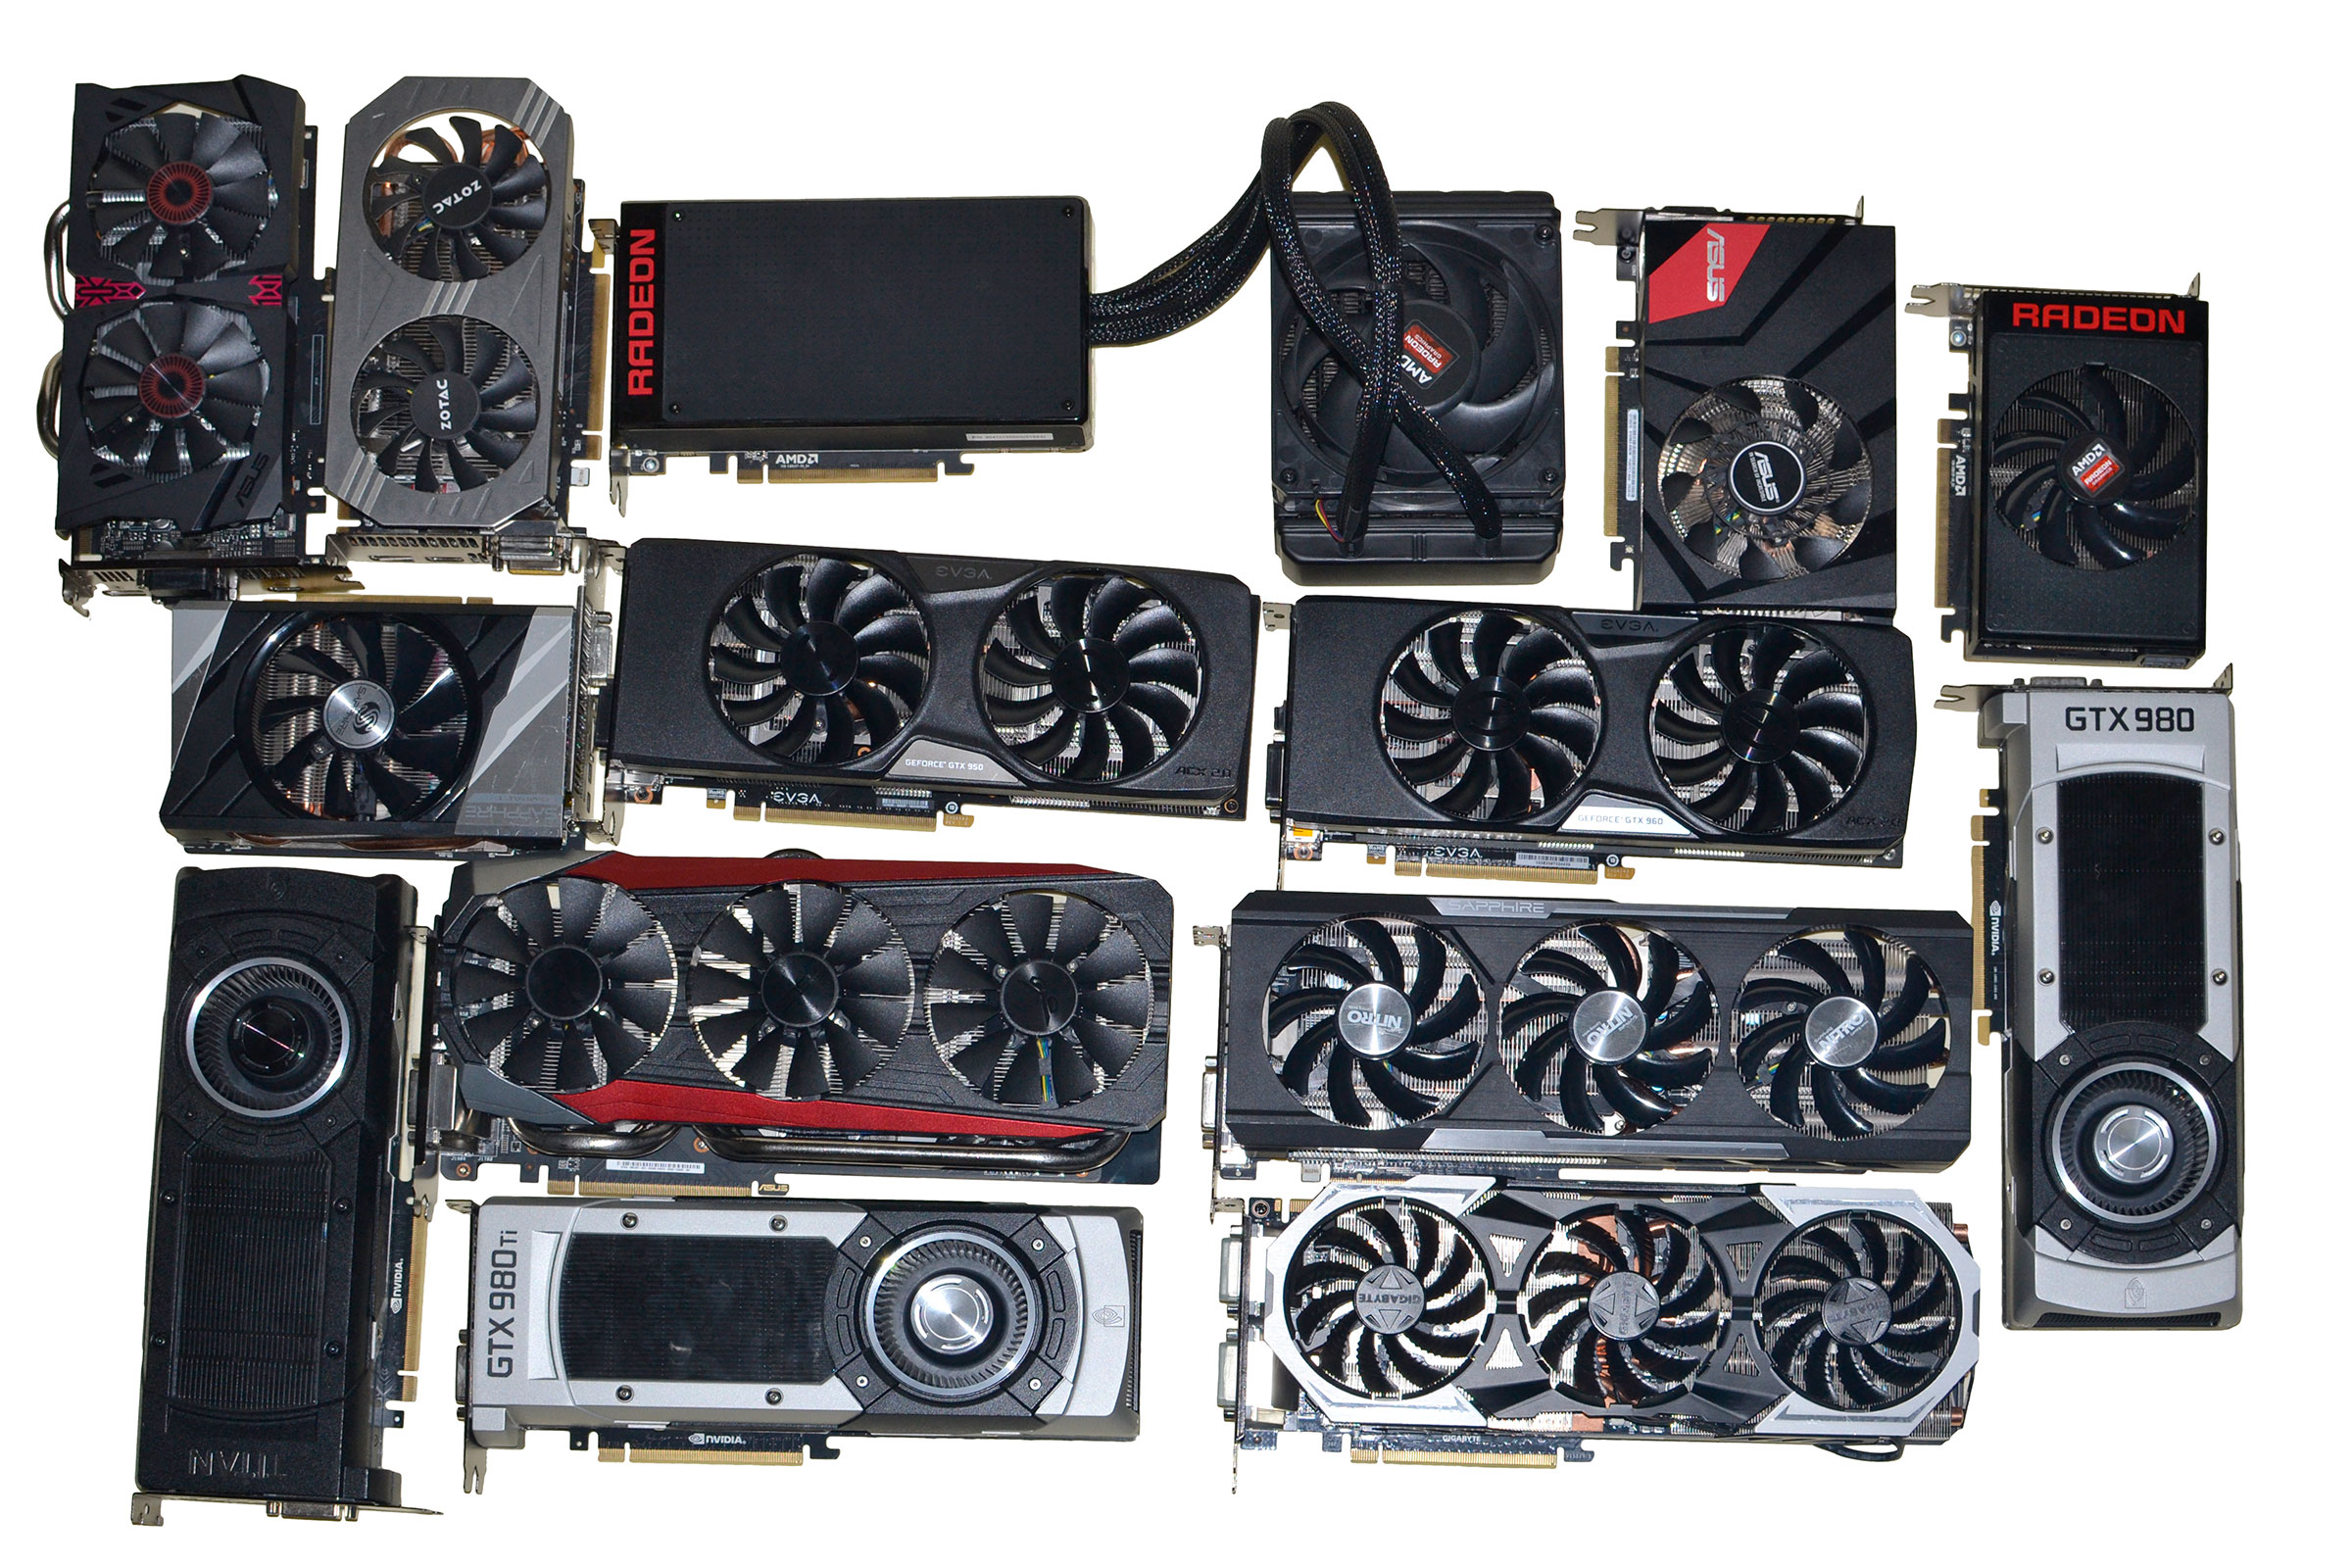
| GPUs | AMD R9 Fury X (Reference)AMD R9 Fury (Asus)AMD R9 Nano (Reference)AMD R9 390 (Sapphire)AMD R9 380X (Sapphire)AMD R9 380 (Sapphire)AMD R9 290X (Gigabyte)AMD R9 285 (Sapphire)Nvidia GTX Titan X (Reference)Nvidia GTX 980 Ti (Reference + Gigabyte)Nvidia GTX 980 (Reference)Nvidia GTX 970 (Asus)Nvidia GTX 960 2GB (EVGA)Nvidia GTX 950 2GB (Asus + EVGA)Nvidia GTX 770 2GB (Reference) |
| SSD | Samsung 850 EVO 2TB |
| PSU | EVGA SuperNOVA 1300 G2 |
| Memory | G.Skill Ripjaws 16GB DDR4-2666 |
| Cooler | Cooler Master Nepton 280L |
| Case | Cooler Master CM Storm Trooper |
| OS | Windows 10 Pro 64-bit |
| Drivers | AMD Crimson 16.3.2 Nvidia 364.72 |
Jarred's love of computers dates back to the dark ages when his dad brought home a DOS 2.3 PC and he left his C-64 behind. He eventually built his first custom PC in 1990 with a 286 12MHz, only to discover it was already woefully outdated when Wing Commander was released a few months later. He holds a BS in Computer Science from Brigham Young University and has been working as a tech journalist since 2004, writing for AnandTech, Maximum PC, and PC Gamer. From the first S3 Virge '3D decelerators' to today's GPUs, Jarred keeps up with all the latest graphics trends and is the one to ask about game performance.

