The Broadwell-E Review
Four new CPUs for enthusiasts, but not so much for gaming.
'Enthusiast' means 'overclocking'
All of the CPUs I'm including in the charts—with the sole exception of the i5-6400—are unlocked CPUs, meaning they're relatively easy to overclock by simply changing the multiplier. There was a time when a 100MHz increase was huge (ah, Celeron 300A, how I loved you!), but now each 100MHz bump is only barely noticeable, and 500MHz or more really marks the point where overclocking potential becomes interesting. With that in mind, I pushed each CPU as far as I could on the multiplier, including increasing voltages to the point where I was no longer comfortable, or until throttling kicked in.
I've mentioned the silicon lottery several times, so perhaps now is as good a time as any to fully explain the term. The transistors in modern processors are etched into a silicon wafer, and right now the wafers are 300mm in diameter. The wafers are cut from a cylinder of silicon, which is made by growing a large monocrystal from a small seed. Here's a good video (slightly outdated, as it says the cylinders are 200mm in diameter—the older standard from about ten years ago) discussing the process. At one point the silicon is said to be 99.999% pure, and it's that 0.001% that represents the 'lottery,' along with the chip's location on the silicon wafer.
The chips near the center of a wafer tend to be higher quality—fewer imperfections and/or impurities—while the outer chips are lower quality. But even chips from the same location on a wafer vary in quality, so one chip may require less voltage in order to run stably, and others may need to have portions of the chip disabled to keep them functional. That's part of why we have Core i7 and i5, or the GTX 1080 and 1070, which all use the same base chip but with certain features or portions of the chip disabled. All of the new Broadwell-E processors (i7-6800K, i7-6850K, i7-6900K, and i7-6950X) use the same chip, but only the 6950X has all ten cores enabled; the implication is that most of the other chips had flaws that prevented them from becoming a full 6950X. In short, a good chip for overclocking is said to have won the 'silicon lottery.'
Intel and AMD tend to skew the results of the lottery, however, as they test the chips in advance—a process called 'binning'—before deciding whether something is a 6950X or a 6800K. We saw the effects of some of this on the power draw, where the 6800K with four fewer cores still used more power at idle and while gaming than the 6950X. When we get to overclocking, the lottery becomes even more of a factor, and with only one sample of each chip, it's impossible to say whether my results are good, bad, or average—though I've checked, and my final OC results on most of the chips appear to be pretty typical.
This is all basically just a big disclaimer to say that overclocking results vary, and there's no guarantee that every chip will reach the same levels shown here. Some will invariably do better, and some will do worse. And with that out of the way, here's a chart showing the final overclocked settings on all of the chips. The goal was to get a chip to pass one billion pi digits in y-cruncher without crashing (multiple times), as it's generally the most demanding of my benchmarks. Many of the processors could do 100-200MHz higher in other tests, but y-cruncher would fail.
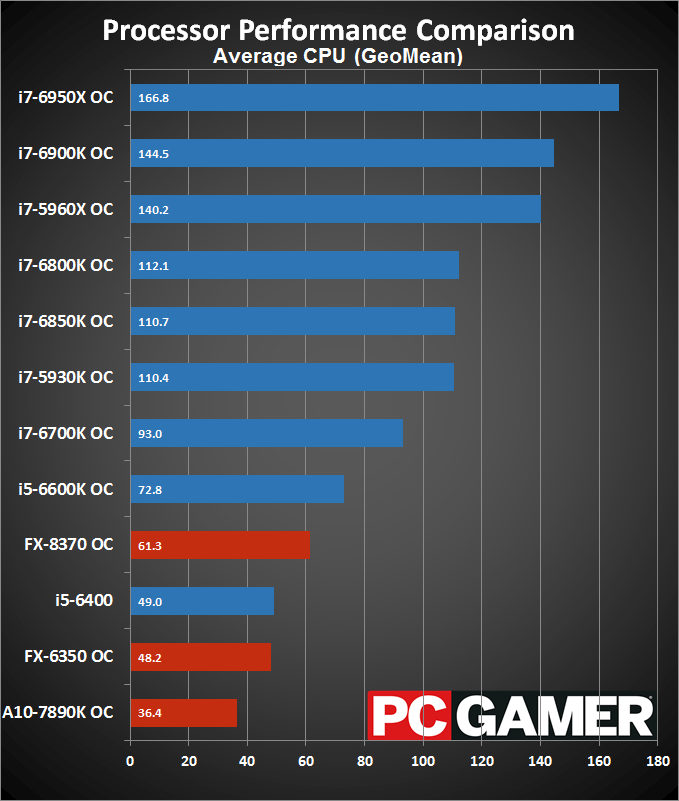
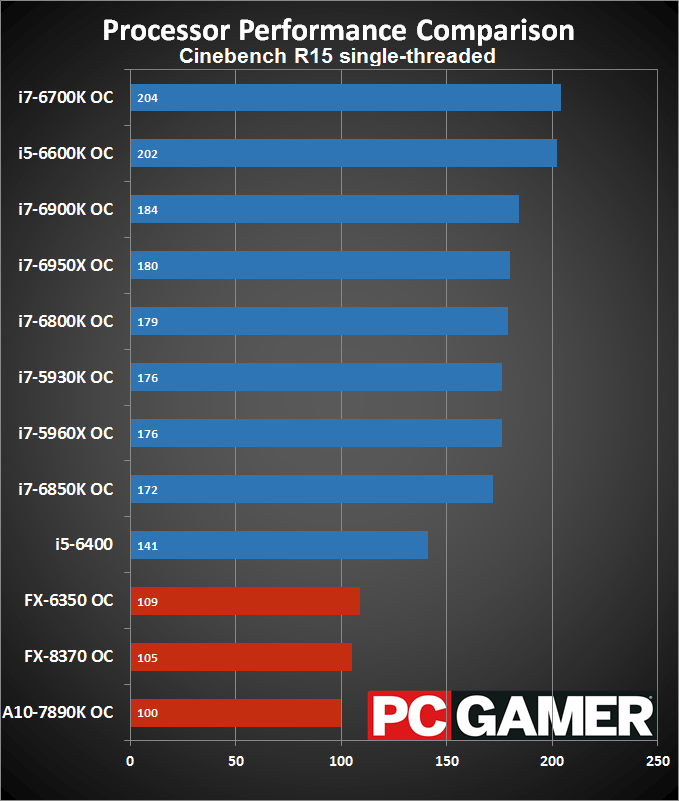
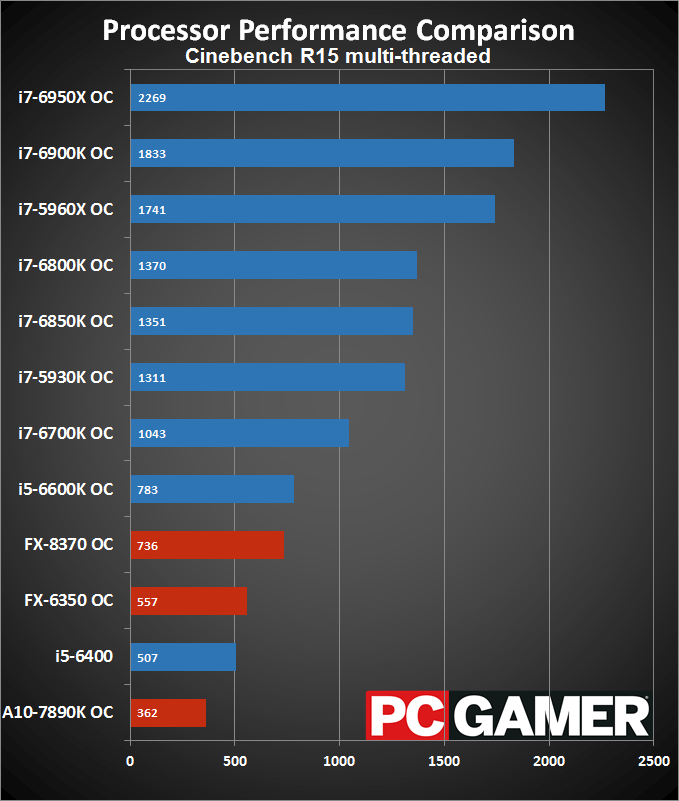
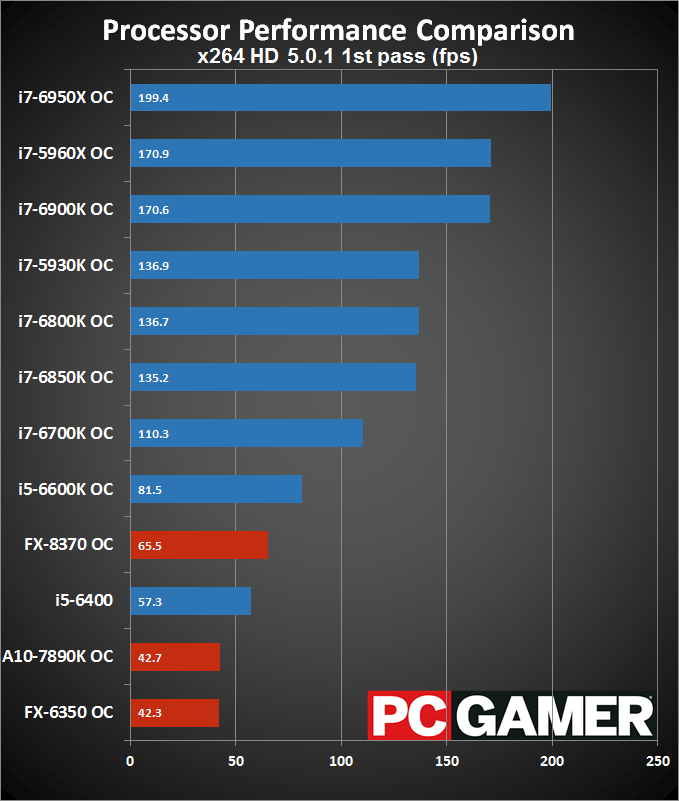
I'm mostly going to focus on the Intel results here, as overclocking the AMD chips simply doesn't get them to the point where they're competitive. What's immediately interesting when looking at my results is that both the Haswell-E chips require less voltage to hit 4.5GHz than the Broadwell-E chips, and the two 6-core BDW-E processors required 1.4V before they would run stably at just 4.4GHz. I'd also note that the i7-6950X and FX-8370 are redlined for overclocking in the y-cruncher test, and for long-term use I'd back off at least 100MHz to be safe. Here's what performance looks like with everything running at the above overclocks, with the stock i5-6400 included as a reference point.
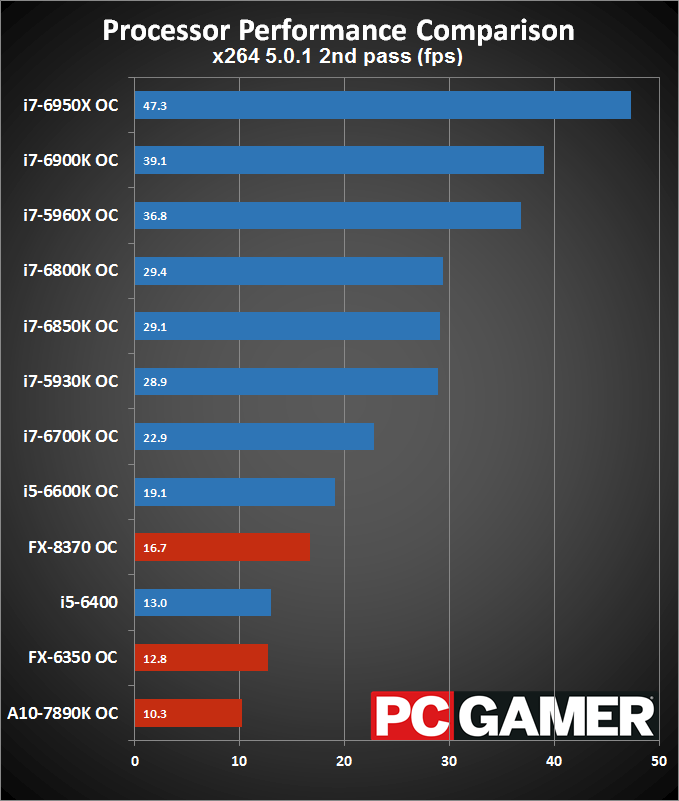
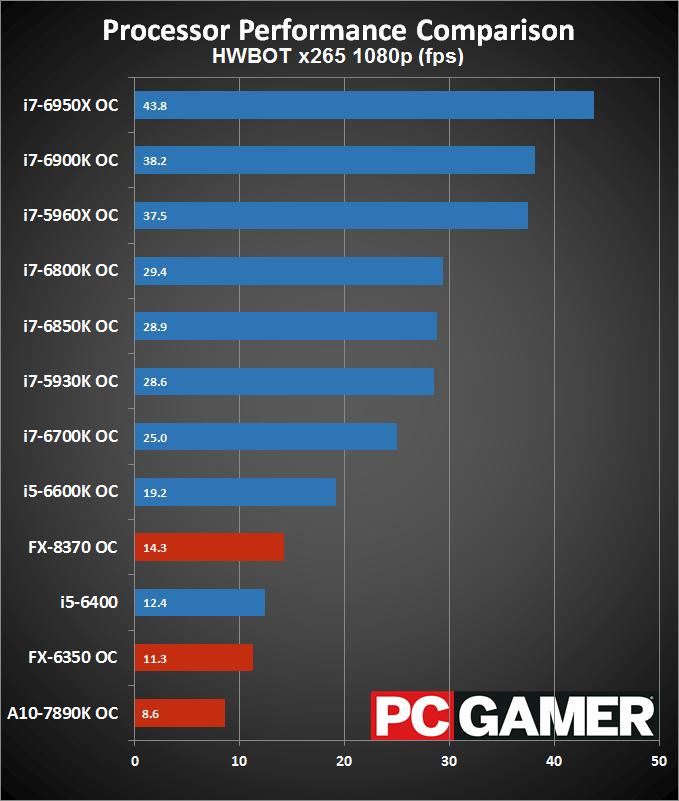
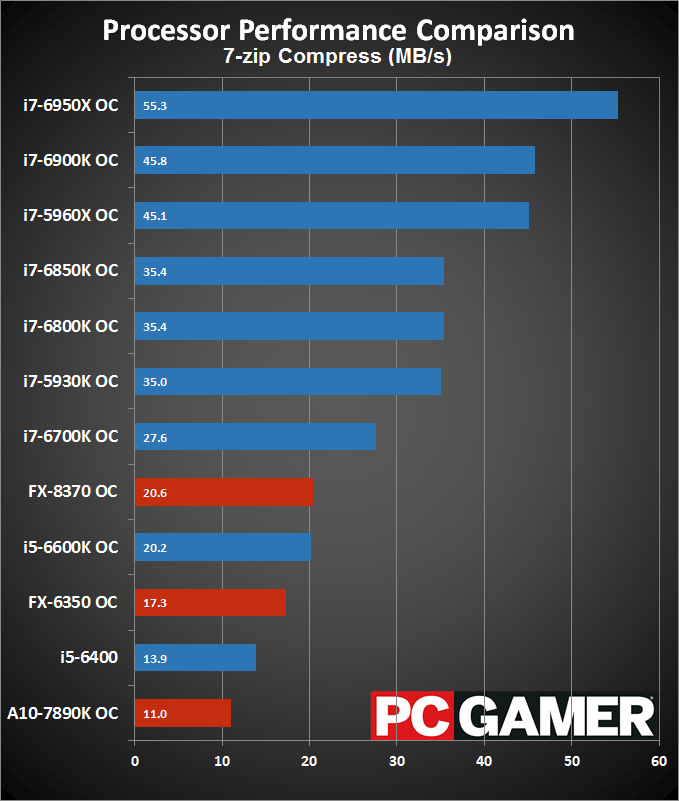
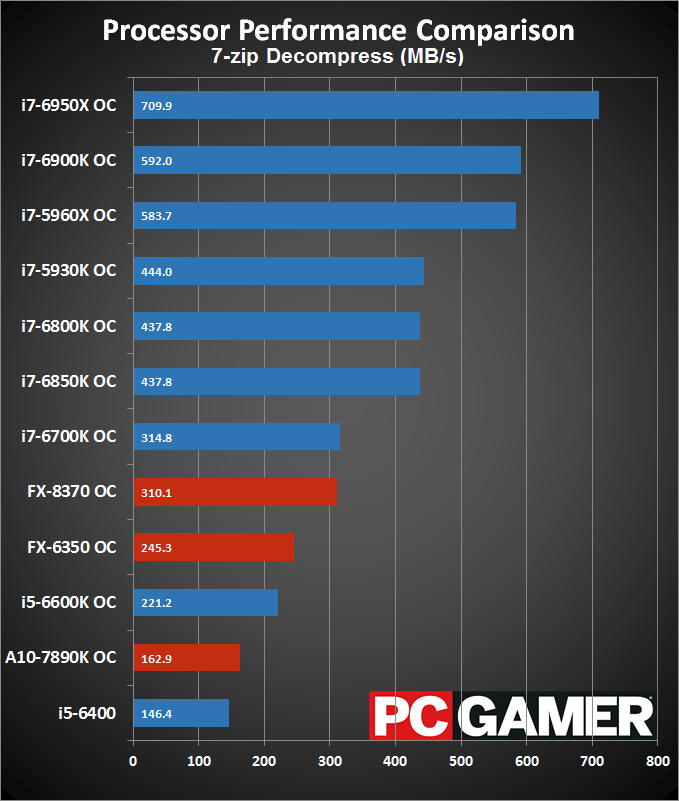
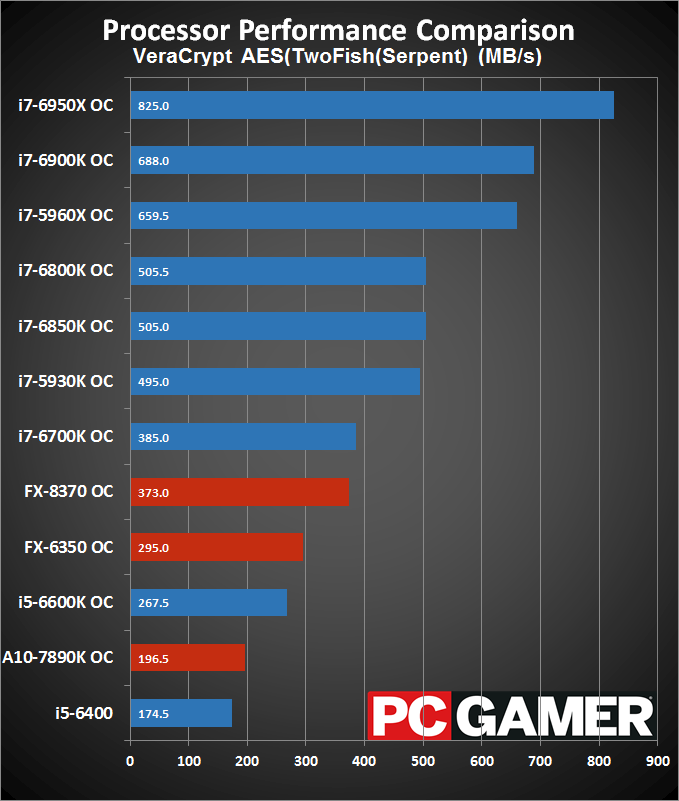
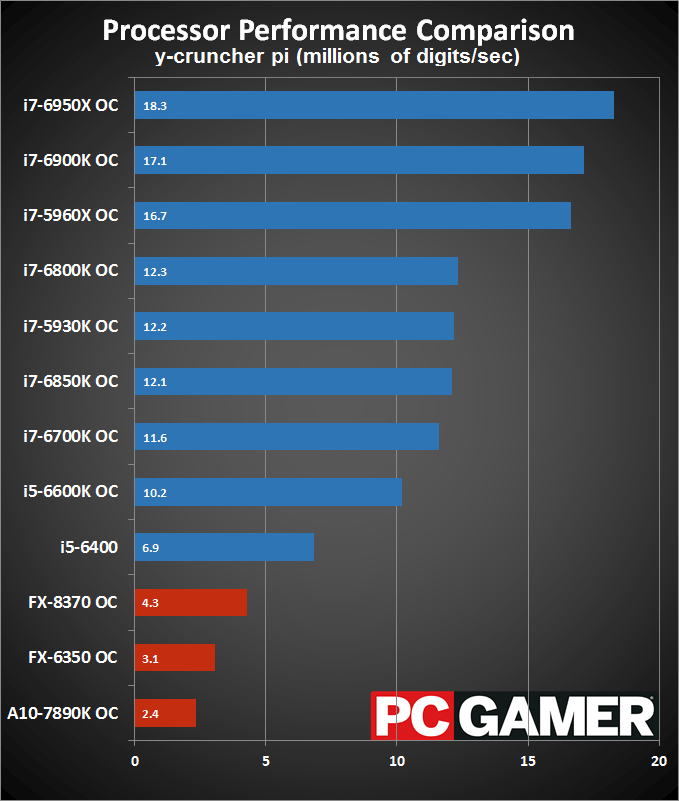
Looking at the composite score, overclocking naturally helps all the processors to varying degrees. I don't have the stock clocks in this chart, but just to put some numbers in place, most of the Intel processors come close to a 20 percent improvement, give or take. The one exception is the i7-6700K, since it already has the highest stock clock of the Intel CPUs, which only improves by 11 percent. AMD's A10 and FX-8370 improve by just under ten percent, while the FX-6350 improves by 13 percent. The two biggest improvements from overclocking, incidentally, are the i7-5960X and i7-5800K, which improve by 23 and 22 percent, respectively.
Keep up to date with the most important stories and the best deals, as picked by the PC Gamer team.
All of the charts below basically follow the average chart, with minor variations. 7-zip compression and y-cruncher improve by a bit less than the average (likely due to memory access bottlenecks) while most other scores improve about the same as the average. I'll dispense with commentary on the charts below, as other than higher scores thanks to overclocking, there's not much to say.
Overclocked power use
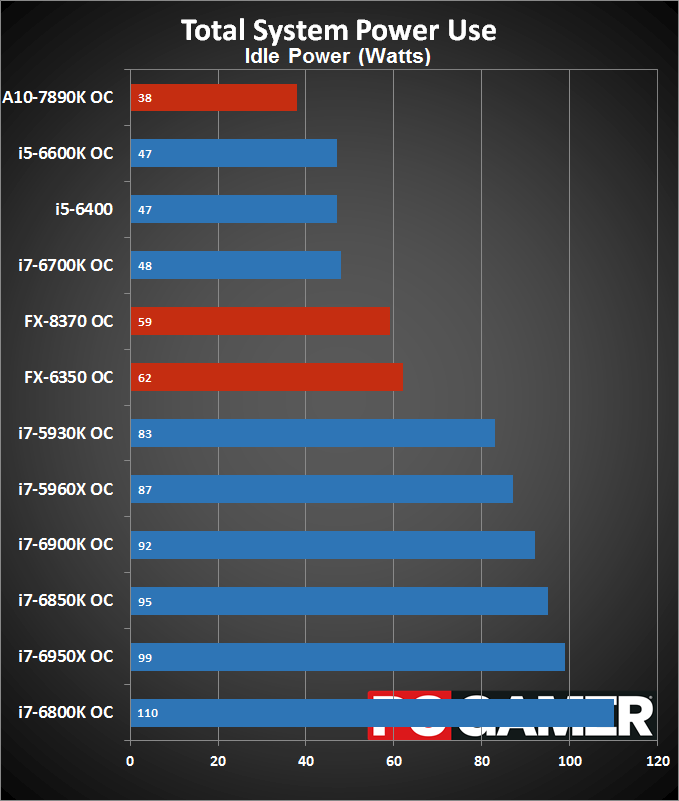
Power use naturally goes up with overclocking as well, often more than the performance increase. Most of the platforms still idle at pretty low power, but others—specifically Broadwell-E on the X99 test system and the AM3+ AMD parts—have a sizeable jump of 10-20 percent. But then put that into perspective with this chart, and it's not a major change. At idle, AMD's APU is the lowest power draw platform right now, Skylake is second, AM3+ comes third, and then all the X99 builds occupy the high power category at the bottom. Again, notice how the i7-6800K sample draws even more power than the i7-6950X; weird but consistent, as if the 6800K is a particularly poor sample (which could make sense as four cores and a bunch of L3 cache were disabled).
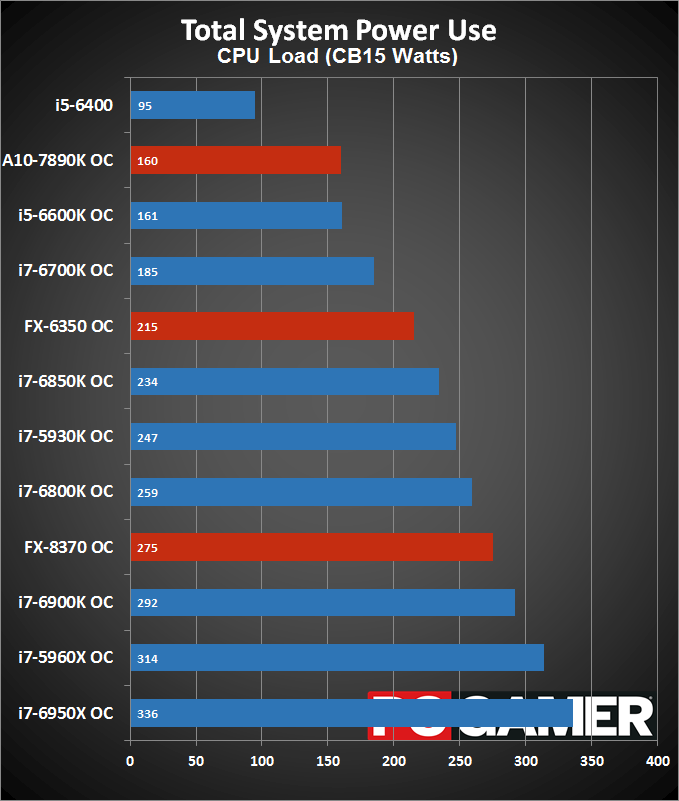
Put a full load on the CPU, and this is basically the worst case for overclocking. The non-overclocked i5-6400 looks nice and takes the top spot, AMD's Kaveri is second, Skylake in general still does well, and the rest of the chips basically sort in order of increasing core counts.
Compared to stock, the smallest increase in power use is the FX-6350, which only uses 17 percent more power. The Skylake, FX-8370, and A10 parts all use around 30-35 percent more power. The next tier consisting of the i7-6850K, i7-6800K, and i7-5930K uses 40-45 percent more power. Finally, i7-5960X power use is up by 60 percent, and the i7-6900K and i7-6950X use 70 percent more power. It's no real surprise that the chips with the most cores end up showing the largest jump in power use here, but you'll definitely want good cooling if you're going to push Broadwell-E very far.
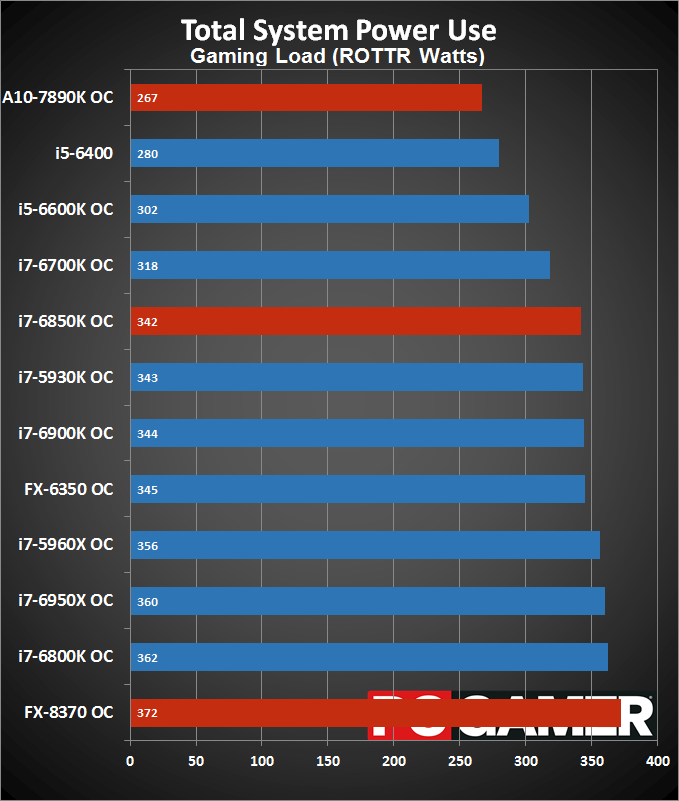
Moving over to gaming power use, slower CPUs and frame rates temper the total power draw of the system, and games don't generally utilize more than four or so processor cores. That leads to most of the X99 chips clustering around the same power level, with Skylake being a superior gaming choice overall. Compared to stock, all of the platforms increase power use by 15 percent or less, though gains in gaming performance are similarly small, as we'll see next.
Jarred's love of computers dates back to the dark ages when his dad brought home a DOS 2.3 PC and he left his C-64 behind. He eventually built his first custom PC in 1990 with a 286 12MHz, only to discover it was already woefully outdated when Wing Commander was released a few months later. He holds a BS in Computer Science from Brigham Young University and has been working as a tech journalist since 2004, writing for AnandTech, Maximum PC, and PC Gamer. From the first S3 Virge '3D decelerators' to today's GPUs, Jarred keeps up with all the latest graphics trends and is the one to ask about game performance.

