SSD Performance: Resetting the Benchmarks
Meet the Benchmarks
Our benchmarks include a mix of real-world and synthetic testing. Each test is run multiple times, ensuring we have repeatable results. In many instances, the first run may show higher (or lower) performance, but subsequent testing will usually show results within a narrow range. Here’s what we’re using along with the settings for each:
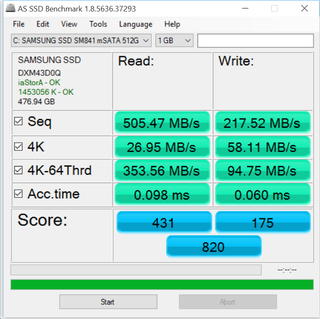
The latest version of AS SSD (1.8.5636.37293) provides theoretical sequential and random transfer rates, and typically represents the best-case and worst-case performance you’ll see from an SSD. We use 10GB of data for the sequential and 4K-64 thread results and 1GB for the 4K-single thread results. We looked at several other similar pieces of software, specifically ATTO 3.05 and CrystalDiskMark 4.1.0, but the data provided was largely redundant with AS SSD.
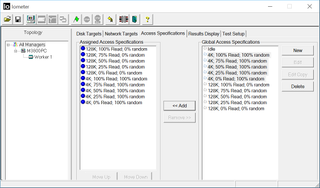
IOmeter is our second theoretical benchmark, again looking at sequential and random transfer rates. We run 10 tests of mixed read/write performance, from 100 percent read/0 percent write to 0 percent read/100 percent write in 25 percent increments. We do this for both 100 percent sequential and 100 percent random IO; we then average (technically, we use the geometric mean so that all results are given equal weight) the five test runs for sequential and random performance to give an aggregate value. The big difference with IOmeter is that each test is run for five minutes, which means the SSDs get a bigger workout than the usual 10–30 second load that you’ll see from AS SSD and similar utilities (25 minutes of total testing per average score). Some drives are able to maintain a high transfer rate for shorter periods of time, and this should stress the hardware enough to give a realistic measurement of sustained performance.
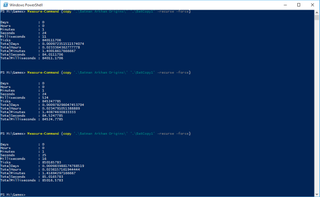
For the “real world”, we have a file copy test. This test copies just shy of 20GB of data (the contents of our Steam Batman: Arkham Origins folder) from one folder on the drive to another folder, so the workload is split 50/50 between reads and writes. Since this test uses core Windows functionality, the results are likely to differ from the theoretical testing the other benchmarks provide. We use Windows PowerShell to perform the copy and time how long it takes for the copy to complete; we then calculate the MB/s based on the amount of data copied.

Finally, we have PCMark 8’s Storage test, with two metrics: the overall Storage score, as well as the Storage Bandwidth score. Rather than a pure test of storage performance, PCMark 8 uses traces of real-world applications and runs these on the test drive. What’s interesting to note with PCMark 8 Storage is that even substantially faster drives tend to deliver diminishing returns. We’ll see this as significantly higher bandwidth results but only marginally higher overall scores.
For most users, PCMark 8 Storage is a good representation of the sort of performance you will actually get from your device. Rarely are desktop users maxing out transfer rates on an SSD for one minute, let alone several minutes; instead, most applications will hit the storage hard for a few seconds and then wait on the user. For example, consider a game where loading a level takes 5–15 seconds, followed by the user playing that level for long periods of time; a fast SSD might load a few seconds quicker than a slow drive, but after the initial work, the SSD goes on siesta. If AS SSD is a best-case result, the PCMark 8 score is more of a worst-case result. What’s interesting is that the bandwidth result of PCMark 8 Storage matches up pretty well with our other tests, again illustrating how faster storage only gets you so far (unless you’re doing a lot of file copying).
The biggest gaming news, reviews and hardware deals
Keep up to date with the most important stories and the best deals, as picked by the PC Gamer team.
Jarred's love of computers dates back to the dark ages when his dad brought home a DOS 2.3 PC and he left his C-64 behind. He eventually built his first custom PC in 1990 with a 286 12MHz, only to discover it was already woefully outdated when Wing Commander was released a few months later. He holds a BS in Computer Science from Brigham Young University and has been working as a tech journalist since 2004, writing for AnandTech, Maximum PC, and PC Gamer. From the first S3 Virge '3D decelerators' to today's GPUs, Jarred keeps up with all the latest graphics trends and is the one to ask about game performance.
